Below are the notes I left, for my housemates, to look after my chicken, Alpha, while I’m away in Europe, for MFRU.
Alpha feeding
What she’s supposed to eat, as a chicken:
Maize, sorghum, sunflower seeds, leftover vegetable scraps, and enough calcium for egg shell development. So, crumple some egg shells in the garden occasionally.
But she’ll only eat maize and sorghum if she’s really hungry. She likes sunflower seeds.
Her faves in decreasing order are:
Superworms
Live Larvae
Dead Larvae
Bread
Cooked rice
(De-shelled) Sunflower seeds
There’s various grains and pulses like millet, rice, lentils, which she’ll eat, if it’s cooked.
When she does the loud alarm noises, or jumps on the table outside Chris’s room, it’s usually the black and white cat. But sometimes it means she’s looking for a place to lay an egg. 95% of the time, she will go back and lay the egg in her box/bed. I think when she crouches down, when you approach, it’s a similar vibe.
Her house has a few features, which need adjustment occasionally. There’s two waterproof umbrella cloths on top, for the rain, usually held in place by a branch, and there’s some polystyrene directly above the box. The box is raised, because she prefers to be higher off the ground, when sleeping. It’s not necessary but after about 6:30pm, when she’s in bed, you can put the ‘satanic apron’ over her box. But first have a quick check for mosquitoes in the box. If there’s lots of mosquitoes, make sure there’s not some sitting water with mosquito larvae in the backyard somewhere. The apron offers a bit more protection from the cold, and light. The chicken house could use some work, but usually it’s fine unless it’s been very windy or rainy.
I change her bedding once a month or so, or if it gets wet in there, after a rain, or if she poops her bed, I’ll take the poop out. Straw or that Alfalfa/Lucerne in the plastic bag works for bedding.
Um… what else… when you steal the eggs, try not to let her see the egg, or she’ll make disapproving sounds.
I change the water every day or two. There doesn’t need to be as many water containers as there are, but just make sure there’s some water around, that the little rat doves haven’t shat in.
Alpha won’t eat the maize, so you can throw a handful in a spot, and the little doves will eat it.
The worms and larvae are pretty good at hiding but there should be a few hundred of each left. Just throw some wet scraps in, occasionally. They’re eating melted instant coffee, and cardboard and grass at the moment.
Alpha will eat as many worms as you give her, so try limit to 10. Internet says 2/day. But that’s for normal, not-spoiled chickens.
She’s picky, until there’s no choices, and then if she’s hungry, she’ll eat whatever’s going. The internet usually knows what she can eat, if you’re going to feed her something new. Usually if it’s grainy or pulsey, or crumby, or anything meaty, or insecty, she’ll give it a try.
Leave some sunflower seeds on top of the bucket where the little rat doves can’t see.
She doesn’t understand pointing at things, or English. But she will usually understand food in hand, or food put in front of her.
Just a quick write-up on the incubator I made, for the fertilized eggs we picked up recently. They were R5 each (€0.28). The goal is to maintain a temperature of 37.5C.
The incubator consists of:
Arduino Nano
DS18B20 temperature sensor
4.7K resistor
Solid state relay module
12V power supply (for the Arduino, and relay)
A relatively inefficient 20W light, on a heatsink.
Some aluminium foil, in a mostly closed plastic container
The eggs were placed a bit above the heatsink, in an egg carton, (hot air rises.) The idea being that we only want conductive heat, not radiative heat, since radiative heat is directional, and will heat one side of the egg more than the other side.
The Arduino code was adapted from the example code from the OneWire library. The controller measures the temperature at the eggs, and turns on the light when the temperature is below 37.5C, and turns it off when it’s above. Using a separate temperature sensor, we confirmed that the temperature remains within a degree of the desired temperature.
There are better ways to do this, I’m sure, but this is what I came up with, on a day’s notice, with the parts available.
The gotchas encountered were, that the Chinese Arduino Nano I used required selecting to upload the sketch, for the ‘old’ bootloader, and the wiring colours of the DS18B20 were incorrectly labelled, (as it was for this forum user).
#include <OneWire.h>

// OneWire DS18S20, DS18B20, DS1822 Temperature Example
//
// http://www.pjrc.com/teensy/td_libs_OneWire.html
//
// The DallasTemperature library can do all this work for you!
// https://github.com/milesburton/Arduino-Temperature-Control-Library


#define SENSOR 2
#define LIGHT 4

OneWire  ds(SENSOR);  // on pin 2 (a 4.7K resistor is necessary)

float desired_temp = 37.5;
float light_status = LOW;


void control(float temperature){
  if (temperature >= desired_temp)
  {
    light_status = LOW;
    Serial.println("HEATER OFF");

  }
  else
  {
    light_status = HIGH;
    Serial.println("HEATER ON");
  }
  digitalWrite(LIGHT, light_status);
}

void setup(void) {
  Serial.begin(9600);
  pinMode(LIGHT, OUTPUT);
}

void loop(void) {
  byte i;
  byte present = 0;
  byte type_s;
  byte data[12];
  byte addr[8];
  float celsius, fahrenheit;

  if ( !ds.search(addr)) {
    Serial.println("No more addresses.");
    Serial.println();
    ds.reset_search();
    delay(250);
    return;
  }

  Serial.print("ROM =");
  for( i = 0; i < 8; i++) {
    Serial.write(' ');
    Serial.print(addr[i], HEX);
  }

  if (OneWire::crc8(addr, 7) != addr[7]) {
      Serial.println("CRC is not valid!");
      return;
  }
  Serial.println();

  // the first ROM byte indicates which chip
  switch (addr[0]) {
    case 0x10:
      Serial.println("  Chip = DS18S20");  // or old DS1820
      type_s = 1;
      break;
    case 0x28:
      Serial.println("  Chip = DS18B20");
      type_s = 0;
      break;
    case 0x22:
      Serial.println("  Chip = DS1822");
      type_s = 0;
      break;
    default:
      Serial.println("Device is not a DS18x20 family device.");
      return;
  }

  ds.reset();
  ds.select(addr);
  ds.write(0x44, 1);        // start conversion, with parasite power on at the end

  delay(1000);     // maybe 750ms is enough, maybe not
  // we might do a ds.depower() here, but the reset will take care of it.

  present = ds.reset();
  ds.select(addr);
  ds.write(0xBE);         // Read Scratchpad

  Serial.print("  Data = ");
  Serial.print(present, HEX);
  Serial.print(" ");
  for ( i = 0; i < 9; i++) {           // we need 9 bytes
    data[i] = ds.read();
    Serial.print(data[i], HEX);
    Serial.print(" ");
  }
  Serial.print(" CRC=");
  Serial.print(OneWire::crc8(data, 8), HEX);
  Serial.println();

  // Convert the data to actual temperature
  // because the result is a 16 bit signed integer, it should
  // be stored to an "int16_t" type, which is always 16 bits
  // even when compiled on a 32 bit processor.
  int16_t raw = (data[1] << 8) | data[0];
  if (type_s) {
    raw = raw << 3; // 9 bit resolution default
    if (data[7] == 0x10) {
      // "count remain" gives full 12 bit resolution
      raw = (raw & 0xFFF0) + 12 - data[6];
    }
  } else {
    byte cfg = (data[4] & 0x60);
    // at lower res, the low bits are undefined, so let's zero them
    if (cfg == 0x00) raw = raw & ~7;  // 9 bit resolution, 93.75 ms
    else if (cfg == 0x20) raw = raw & ~3; // 10 bit res, 187.5 ms
    else if (cfg == 0x40) raw = raw & ~1; // 11 bit res, 375 ms
    //// default is 12 bit resolution, 750 ms conversion time
  }
  celsius = (float)raw / 16.0;
  fahrenheit = celsius * 1.8 + 32.0;
  Serial.print("  Temperature = ");
  Serial.print(celsius);
  Serial.print(" Celsius, ");
  Serial.print(fahrenheit);
  Serial.println(" Fahrenheit");

  control(celsius);
}
As the eggs reach maturity, we’ll get a ‘hatcher’ environment ready.
Here I’m continuing with the task of unsupervised detection of audio anomalies, hopefully for the purpose of detecting chicken stress vocalisations.
After much fussing around with the old Numenta NuPic codebase, I’m porting the older nupic.audio and nupic.critic code, over to the more recent htm.core.
These are the main parts:
Sparse Distributed Representation (SDR)
Encoders
Spatial Pooler (SP)
Temporal Memory (TM)
I’ve come across a very intricate implementation and documentation, about understanding the important parts in the HTM model, way deep, like how did I get here? I will try implement the ‘critic’ code, first. Or rather, I’ll try port it from nupic to htm. After further investigation, there’s a few options, and I’m going to try edit the hotgym example, and try shove wav files frequency band scalars through it instead of power consumption data. I’m simplifying the investigation. But I need to make some progress.
I’m using this docker to get in, mapping my code and wav file folder in:
docker run -d -p 8888:8888 --name jupyter -v /media/chrx/0FEC49A4317DA4DA/sounds/:/home/jovyan/work 3rdman/htm.core-jupyter:latest


So I've got some code working that writes to 'nupic format' (.csv) and code that reads the amplitudes from the csv file, and then runs it through htm.core.

So it takes a while, and it's just for 1 band (of 10 bands). I see it also uses the first 1/4 of so of the time to know what it's dealing with.  Probably need to run it through twice to get predictive results in the first 1/4.

Ok no, after a few weeks, I've come back to this point, and realise that the top graph is the important one.  Prediction is what's important.  The bottom graphs are the anomaly scores, used by the prediction.
Frequency Band 0
The idea in nupic.critic, was to threshold changes in X bands. Let’s see the other graphs…
Frequency band 0: 0-480Hz ?Frequency band 2: 960-1440Hz ?Frequency band 3: 1440-1920Hz ? Frequency band 4: 1920-2400Hz ? Frequency band 5: 2400-2880Hz ? Frequency band 6: 2880-3360Hz ?
Ok Frequency bands 7, 8, 9 were all zero amplitude. So that’s the highest the frequencies went. Just gotta check what those frequencies are, again…
Opening 307.wav
Sample width (bytes): 2
Frame rate (sampling frequency): 48000
Number of frames: 20771840
Signal length: 20771840
Seconds: 432
Dimensions of periodogram: 4801 x 2163

Ok with 10 buckets, 4801 would divide into
Frequency band 0: 0-480Hz
Frequency band 1: 480-960Hz
Frequency band 2: 960-1440Hz
Frequency band 3: 1440-1920Hz
Frequency band 4: 1920-2400Hz
Frequency band 5: 2400-2880Hz
Frequency band 6: 2880-3360Hz
Ok what else. We could try segment the audio by band, so we can narrow in on the relevant frequency range, and then maybe just focus on that smaller range, again, in higher detail.
Learning features with some labeled data, is probably the correct way to do chicken stress vocalisation detections.
Unsupervised anomaly detection might be totally off, in terms of what an anomaly is. It is probably best, to zoom in on the relevant bands and to demonstrate a minimal example of what a stressed chicken sounds like, vs a chilled chicken, and compare the spectrograms to see if there’s a tell-tale visualisable feature.
A score from 1 to 5 for example, is going to be anomalous in arbitrary ways, without labelled data. Maybe the chickens are usually stressed, and the anomalies are when they are unstressed, for example.
A change in timing in music might be defined, in some way. like 4 out of 7 bands exhibiting anomalous amplitudes. But that probably won’t help for this. It’s probably just going to come down to a very narrow band of interest. Possibly pointing it out on a spectrogram that’s zoomed in on the feature, and then feeding the htm with an encoding of that narrow band of relevant data.
I’ll continue here, with some notes on filtering. After much fuss, the sox app (apt-get install sox) does it, sort of. Still working on python version.
$ sox 307_0_50.wav filtered_50_0.wav sinc -n 32767 0-480
$ sox 307_0_50.wav filtered_50_1.wav sinc -n 32767 480-960
$ sox 307_0_50.wav filtered_50_2.wav sinc -n 32767 960-1440
$ sox 307_0_50.wav filtered_50_3.wav sinc -n 32767 1440-1920
$ sox 307_0_50.wav filtered_50_4.wav sinc -n 32767 1920-2400
$ sox 307_0_50.wav filtered_50_5.wav sinc -n 32767 2400-2880
$ sox 307_0_50.wav filtered_50_6.wav sinc -n 32767 2880-3360
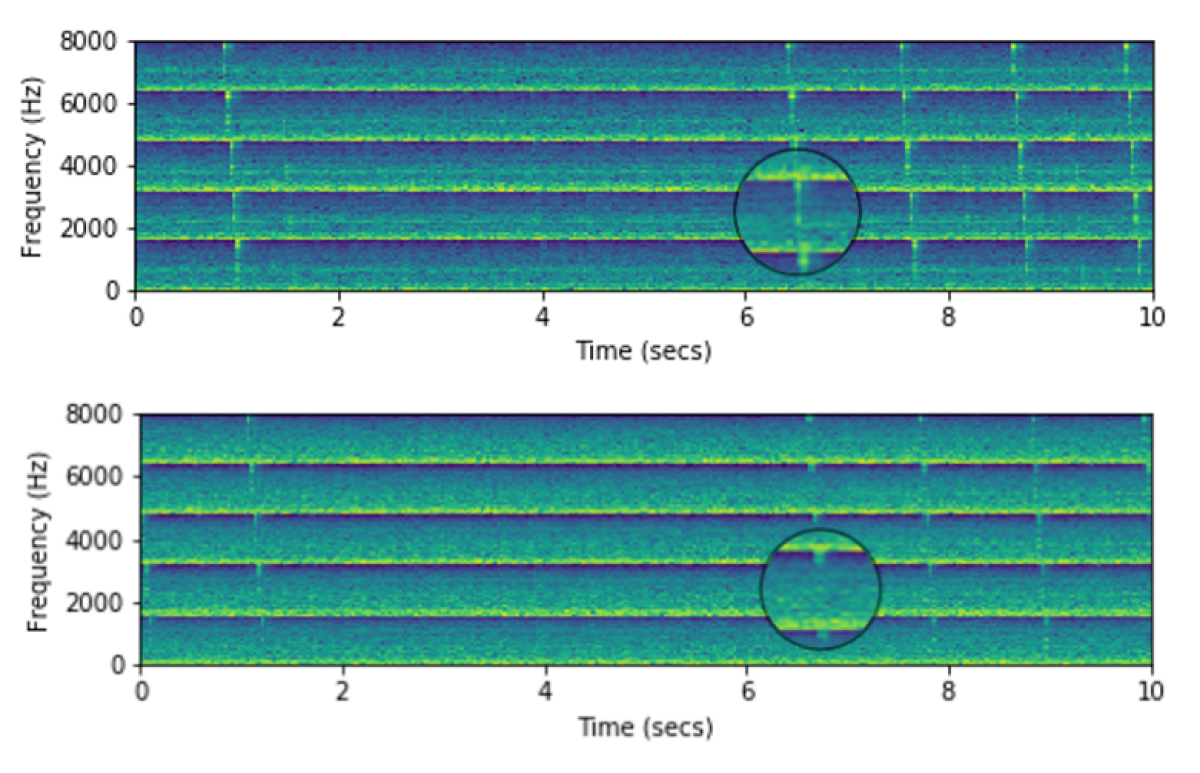
So, sox does seem to be working. The mel spectrogram is logarithmic, which is why it looks like this.
Visually, it looks like I'm interested in 2048 to 4096 Hz. That's where I can see the chirps.
Hmm. So I think the spectrogram is confusing everything.
So where does 4800 come from? 48 kHz. 48,000 Hz (48 kHz) is the sample rate “used for DVDs“.
Ah. Right. The spectrogram values represent buckets of 5 samples each, and the full range is to 24000…?
ok. So 2 x 24000. Maybe 2 channels? Anyway, full range is to 48000Hz. In that case, are the bands actually…
Frequency band 0: 0-4800Hz
Frequency band 1: 4800-9600Hz
Frequency band 2: 9600-14400Hz
Frequency band 3: 14400-19200Hz
Frequency band 4: 19200-24000Hz
Frequency band 5: 24000-28800Hz
Frequency band 6: 28800-33600Hz
Ok so no, it’s half the above because of the sample width of 2.
Frequency band 0: 0-2400Hz
Frequency band 1: 2400-4800Hz
Frequency band 2: 4800-7200Hz
Frequency band 3: 7200-9600Hz
Frequency band 4: 9600-12000Hz
Frequency band 5: 12000-14400Hz
Frequency band 6: 14400-16800Hz
So why is the spectrogram maxing at 8192Hz? Must be spectrogram sampling related.
So the original signal is 0 to 24000Hz, and the spectrogram must be 8192Hz because… the spectrogram is made some way. I’ll try get back to this when I understand it.
Ok i don’t entirely understand the last two. But basically the mel spectrogram is logarithmic, so those high frequencies really don’t get much love on the mel spectrogram graph. Buggy maybe.
So now I’m plotting the ‘chirp density’ (basically volume).
’98.wav’‘237.wav’‘307.wav’‘3072.wav’
In this scheme, we just proxy chirp volume density as a variable representing stress. We don’t know if it is a true proxy. As you can see, some recordings have more variation than others.
Some heuristic could be decided upon, for rating the stress from 1 to 5. The heuristic depends on how the program would be used. For example, if it were streaming audio, for an alert system, it might alert upon some duration of time spent above one standard deviation from the rolling mean. I’m not sure how the program would be used though.
If the goal were to differentiate stressed and not stressed vocalisations, that would require labelled audio data.
We’ve spoken with Dr. Maksimiljan Brus, at the University of Maribor, and he’s sent us some WAV file recordings of a large group of chickens.
There seems to be a decent amount of work done, particularly at Georgia Tech, regarding categorizing chicken sounds, to detect stress, or bronchitis, etc. They’ve also done some experiments to see how chickens react to humans and robots. (It takes them about 3 weeks to get used to either).
In researching the topic, there was a useful South African document related to smallholding size chicken businesses. It covers everything. Very good resource, actually, and puts into perspective the relative poverty in the communities where people sell chickens for a living. The profit margin per chicken in 2013 was about R12 per live chicken (less than 1 euro).
From PRODUCTION GUIDELINES for Small-Scale Broiler Enterprises K Ralivhesa, W van Averbeke & FK Siebrits
So anyway, I’m having a look at the sound files, to see what data and features I can extract. There’s no labels, so there won’t be any reinforcement learning here. Anomaly detection doesn’t need labels, and can use moving window statistics, to notice when something is out of the ordinary. So that’s what I’m looking into.
I am personally interested in Numenta’s algorithms, such as HTM, which use a model of cortical columns, and sparse encodings, to predict, and detect anomalies. I looked into getting Nupic.critic working, but Nupic is so old now, written in Python 2, that it’s practically impossible to get working. There is a community fork, htm.core, updated to Python 3, but it’s missing parts of the nupic codebase that nupic.critic is relying on. I’m able to convert the sound files to the nupic format, but am stuck for now, when running the analysis.
So let’s start at a more basic level and work our way up.
I downloaded Praat, an interesting sound analysis program used for some audio research. Not sure if it’s useful here. But it’s able to show various sound features. I’ll close it again, for now.
So, first thing to do, is going to be Mel spectrograms, and possibly Mel Frequency Cepstral Coefficients (MFCCs). The Mel scale kinda allows a difference between 250Hz and 500Hz to be scaled to the same size as a difference between 13250Hz and 13500Hz. It’s log-scaled.
Mel spectrograms let you use visual tools on audio. Also, worth knowing what a feature is, in machine learning. It’s a measurable property.
Ok where to start? Maybe librosa and PyOD?
pip install librosa
Ok and this outlier detection medium writeup, PyOD, says
Neural Networks
Neural networks can also be trained to identify anomalies.
Autoencoder (and variational autoencoder) network architectures can be trained to identify anomalies without labeled instances. Autoencoders learn to compress and reconstruct the information in data. Reconstruction errors are then used as anomaly scores.
More recently, several GAN architectures have been proposed for anomaly detection (e.g. MO_GAAL).
There’s also the results of a group working on this sort of problem, here.
Here was an illustrative example of an anomaly, of some machine sound.
And of course, there are more traditional? algorithms, (data-science algorithms). Here’s a medium article overview, for a submission to a heart murmur challenge. It mentions kapre, “Keras Audio Preprocessors – compute STFT, ISTFT, Melspectrogram, and others on GPU real-time.”
Here’s a useful flowchart from a paper about edge sound analysis on a Teensy. Smart Audio Sensors (SASs). The code “computes the FFT and Mel coefficients of a recorded audio frame.”
Smart Audio Sensors in the Internet of Things Edge for Anomaly Detection
I haven’t mentioned it, but of course FFT, Fast Fourier Transform, which converts audio to frequency bands, is going to be a useful tool, too. “The FFT’s importance derives from the fact that it has made working in the frequency domain equally computationally feasible as working in the temporal or spatial domain. ” – (wikipedia)
On the synthesis and possibly artistic end, there’s also MelGAN and the like.
Google’s got pipelines in kubernetes ? MLOps stuff.
Artistically speaking, it sounds like we want spectrograms. Someone implements one from scratch here, and there is a link to a good youtube video on relevant sound analysis ideas. Wide-band, vs. narrow-band, for example. Overlapping windows? They’re explaining STFT, which is used to make spectrograms.
Anyway. Good stuff. As always, I find the hardest part is finding your way back to your various dev environments. Ok I logged into the Jupyter running in the docker on the Jetson. ifconfig to get the ip, and http://192.168.101.115:8888/lab, voila).
Ok let’s see torchaudio’s colab… and pip install, ok… Here’s a summary of the colab.
Some ghostly Mel spectrogram stuff. Also, interesting ‘To recover a waveform from spectrogram, you can use GriffinLim.’
Ok let’s get our own dataset prepared. We need an anomaly detector. Let’s see…
———————— <LIBROSA INSTALLATION…> —————
Ok the librosa mel spectrogram is working, at least, so far. So these are the images for the 4 files Dr. Brus sent.
While looking for something like STFT to make a spectogram video, i came across this resource: Machine Hearing. Also this tome of ML resources.
Classification is maybe the best way to do this ML stuff. Then you can add labels to classes, and train a neural network to associate labels, and to categorise. So it would be ideal, if the data were pre-labelled, i.e. classified by chicken stress vocalisation experts. Like here is a soundset with metadata, that lets you classify sounds with labels, (with training).
So we really do need to use an anomaly detection algorithm, because I listened to the chickens for a little bit, and I’m not getting the nuances.
Here’s a relevant paper, which learns classes, for retroactive labelling. They’re recording a machine making sounds, and then humans label it. They say 1NN (k-nearest-neighbours) is hard to beat, but it’s memory intensive. “Nearest centroid (NC) combined with DBA has been shown to be competitive with kNN at a much smaller computational cost”.
Ok, let’s hope this old link works, for a nupic docker.
sudo docker run -i -t numenta/nupic /bin/bash
Ok amazing. Ok right, trying to install matplotlib inside the docker crashes. urllib3. I’ve been here before. Right, I asked on the github issues. 14 days ago, I asked. I got htm.core working. But it doesn’t have nupic.data classes.
After bashing my head against the apparent impossibility to pip install urllib3 and matplotlib in a python 2.7 docker, I’ve decided I will have to port the older nupic.critic or nupic.audio code to htm.core.
I cleared up some harddrive space, and ran this docker:
docker run -d -p 8888:8888 --name jupyter 3rdman/htm.core-jupyter:latest

then get the token for the URL:
docker logs -f jupyter
There’s a lot to go through, and I’m a noob at HTM. So I will start a new article now, on HTM specifically, for this.
Obviously they’re all for industry. China and Thailand apparently has ‘robot nannies‘ monitoring chicken health. There’s also some robots for feeding chickens, and for keeping them on their toes, by driving into them…
PoulBot is a bit closer to the magic side, studying social ecology, with a robot for chicks to imprint on, who takes chicks around, and counts the chicks and goes back for any left behind. It beeps instead of clucks. The above-head camera is probably not realistic for most settings, but it allows a useful behaviour they call avoid-running-over-chick. The idea is to work out what cues are required for chicks to accept a robot as a mother.
“When applied to a reinforcing dataset containing 27,828 images of chickens in a stunned state, the identification accuracy of the model was 98.06%. This was significantly higher than both the established back propagation neural network model (90.11%) and another Faster-RCNN model (96.86%). The proposed algorithm can complete the inspection of the stunned state of more than 40,000 broilers per hour. The approach can be used for online inspection applications to increase efficiency, reduce labor and cost, and yield significant benefits for poultry processing plants.” https://www.sciencedirect.com/science/article/pii/S0032579119579093
Their abstract frames benefit in terms of slaughtering efficiency. Interesting ‘local optima’ ethics-wise. But yes, since we kill 178 million broiler chickens a day, we should at least have an AI checking that the stunning worked. Perhaps implement some “Ethics policy” to re-stun the chicken, if not properly stunned.
(Stunning means the conveyor belt dipping chickens’ heads into electrified water, to stun them, so their heads dangle and can be ripped off mechanically)
Fighting: “This fighting often continues until they reach maturity and the pecking order is well established.”
Foraging: “In the wild, jungle fowl spend 61% of their time foraging. Foraging behaviors include pecking and scratching at potential food sources, as well as looking for and sampling possible food sources. Providing chickens with a complete feed eliminates the need for foraging in order to obtain nutrients, but the hens will continue performing this behavior”
Firstly, an apology that I can’t speak Swedish! I hope that’s ok.
My name is Miranda and I am a Master’s student in Sustainable Design at Linnaeus University in Växjö. I am working on a practical research project which aims to decrease cruelty in the mass egg farming industry by using technology to provide humane, cost-effective alternatives for large-scale commercial battery farms.
I found out about your farm from the Reko Ring, and I was wondering if you may be open to me coming to visit to do some research? Your small scale, free-range practices are exactly what we would like to convince big agri-business should be possible in the future.
The research would entail me taking some video footage of the chickens and where they live, seeing how they respond to a small robot prototype, and hopefully, if you have time, asking you some questions about your sustainable chicken farming practices.
I hope that you will be interested in contributing to research in pursuit of a more sustainable future! Please let me know if you have any questions.
All the very best, Miranda Moss.
Dagar Groblad <dagar.groblad@gmail.com>
17 August 2020 at 06:09
To: miranda moss <miranda.and.a.moss@gmail.com>
Hello Miranda,
I think you have sent the e-mail to the wrong person. We are not Ulrika and Tomas, and we do not have chickens. Good luck with your research!
Best Regards
Dagar Groblad[Quoted text hidden]
miranda moss <miranda.and.a.moss@gmail.com>
17 August 2020 at 14:51
To: Dagar Groblad <dagar.groblad@gmail.com>
Hi Dagar Sorry for the mistake! It must have been a strange email to receive! Thanks for letting me know though. All the best,Miranda. [Quoted text hidden]
Dagar Groblad <dagar.groblad@gmail.com>
17 August 2020 at 14:54
To: miranda moss <miranda.and.a.moss@gmail.com>
No problem, and not strange. Happy that people like you exist. Together we build something new to try and make a better world. All the best.Dagar [Quoted text hidden]
miranda moss <miranda.and.a.moss@gmail.com>
18 August 2020 at 09:05
To: Dagar Groblad <dagar.groblad@gmail.com>
Thanks for your kind words and encouragement 🙂 Best of luck for you too, on your journey to making a better world![Quoted text hidden]
My name is Miranda, and I’m a Cape Townian, but am currently studying a Master’s degree in Sustainable design in Sweden. Although I’m far away from home, my heart is still there, and the work I do in sustainability is still for South Africa. I’m currently working on a project which aims to design cheap technological aids which will improve egg farming, for both the farmers and the chickens. I was wondering if you would be open to having an online / watsapp call interview? I would like to know if my ideas would be useful for a farm like yours, and how my inventions could be tailored to a chicken farm’s needs. I found out about chamomile farming from the Newspaper article, and was inspired by your story. I hope my inventions would be able to help small, but successfully growing family-run businesses like yours. I hope to hear from you!